Re: Compilation of Michael Jordan’s on-off data with the Bulls
Posted: Thu Feb 1, 2024 3:08 pm
The numbers were explicitly said to assume equal lineup results. Yes, logically that would not actually be the case.
Sports is our Business
https://forums.realgm.com/boards/
https://forums.realgm.com/boards/viewtopic.php?f=64&t=2314587
colts18 wrote:Owly wrote:eminence wrote:Also, I said +900 or whatever, lol. That's an extreme extreme number. Guys we have on record who hit +900 on the season: '96 MJ, '15-'17 Curry, and '16 Green. Poor '96 Pippen one point short.
And given overall team quality/number of games in a season, it's entirely possible those are the only players to ever do it.
Teams with a points dif of better than 800 through 2019 were.
1971-72 Los Angeles Lakers* 1007
1970-71 Milwaukee Bucks* 1005
1995-96 Chicago Bulls* 1004
2016-17 Golden State Warriors* 954
1971-72 Milwaukee Bucks* 915
1996-97 Chicago Bulls* 886
2015-16 Golden State Warriors* 882
2015-16 San Antonio Spurs* 872
1991-92 Chicago Bulls* 856
2007-08 Boston Celtics* 841
2014-15 Golden State Warriors* 828
If (hypothetically) those teams maintained a constant points margin regardless of lineup (or did so with regard to the following players) the minute leaders and their "expected" pro-rata plus-minus would be
Wilt Chamberlain 883.0341254
Kareem Abdul-Jabbar 835.0442366
Michael Jordan 786.2037506
Klay Thompson 638.8134479
Kareem Abdul-Jabbar 828.7272497
Michael Jordan 697.3938165
Draymond Green 622.9014085
Kawhi Leonard 526.60746
Scottie Pippen 682.9006556
Paul Pierce 611.7524677
Stephen Curry 548.2929549
Your Wilt numbers are off. There is no way that Wilt was only +883 on a +1007 team. Wilt played all 82 games and was at 42.3 MPG. He only 482 minutes that season. He played 88% of the Lakers minutes. He is definitely over 900. He is possibly over +1000 assuming the Lakers were negative in the minutes he missed.
It's the same with the 1971 Bucks. Kareem played all 82 games at 40 MPG and Oscar played 81 at 39 MPG. They both likely beat the +900 since the Bucks were over +1000. The 1972 Bucks might be the same since Kareem played 81 games at 44 MPG.
If (hypothetically) those teams maintained a constant points margin regardless of lineup (or did so with regard to the following players) the minute leaders and their "expected" pro-rata plus-minus would be
lessthanjake wrote:...
Djoker wrote:lessthanjake wrote:...
Alright so I've been able to do some serious data clean-up. In this post I will summarize the updated data and point out a few small inconsistencies I see in the OP.
Regular Season
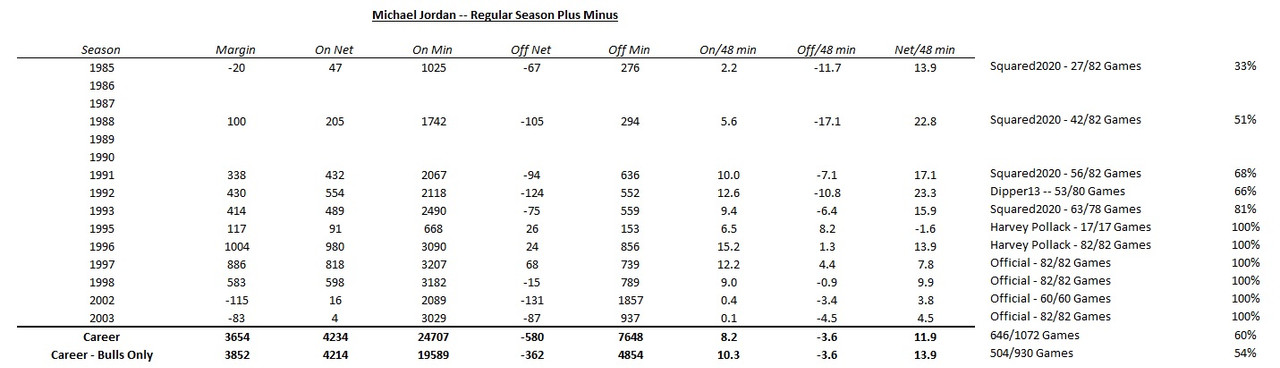
I looked at the Raw Plus Minus spreadsheet that I think Eminence also posted in this thread and realized that there is MJ regular season data for 1994-95 on there for the 17 games he played: +91 ON 668 ON Mins +26 OFF 153 OFF Mins. 1994-95 regular season can be added to the OP.
I noticed that the OP has different ON and OFF values for the 1987-88 season. Like mine, I think his data only includes the 42 full games and excludes the one game fragment on 01-09-88 so not sure why it's different?
I also have a different OFF for the 1992-93 season. For the 63 sampled games, the margin is +414 so since the ON is +489 the OFF value should be -75. Please confirm.
The total regular season data we have have for Jordan comprises 60% of his total career and 54% of his Bulls career.
Playoffs
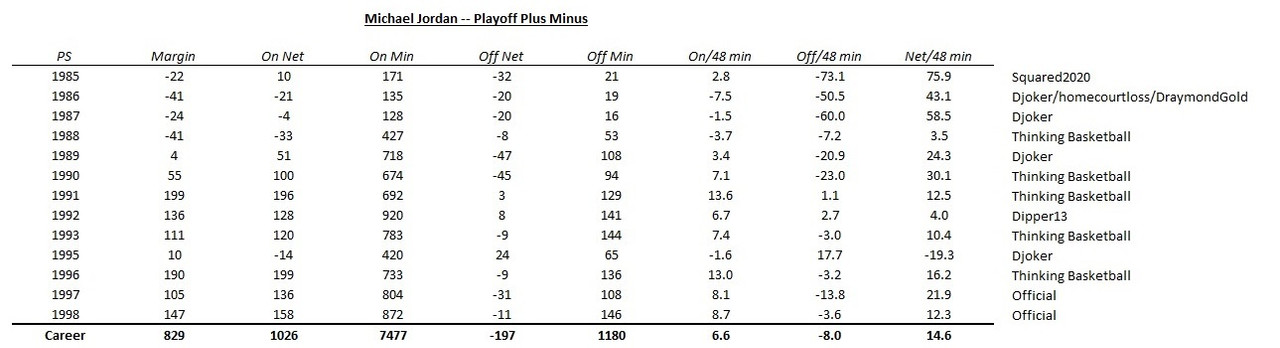
First off I noticed a typo in the OP. The 1985 playoffs should have an OFF value of -32 and not -22.
I logged the Knicks and Pistons series for 1989 because the Thinking Basketball (TB) numbers didn't match the total score margins.
Knicks: +45 ON -20 OFF (was +65 ON -30 OFF)
Pistons: -16 ON -9 OFF (was -19 OFF +12 OFF)
1989 Total: +51 ON -47 OFF (was +63 ON -41 OFF)
I also logged the Sixers series for 1990 because the TB numbers again didn't match the total score margins.
Sixers: +45 ON -7 OFF (was +45 ON -9 OFF)
1990 Total: +100 ON -45 OFF (was +100 ON -47 OFF)
In the 1995 playoffs, I found an arithmetic error in Game 1 of the Hornets series that I logged. Instead of +11 ON -3 OFF it's actually +6 ON +2 OFF.
1995 Total: -14 ON +24 OFF (was -9 ON +19 OFF)
Here is the updated playoff picture.
I noticed some minor inconsistencies in both ON and OFF minutes but they aren't significant at all.
Djoker wrote:lessthanjake wrote:...
Did you get a chance to look at my post?Djoker wrote:lessthanjake wrote:...
Alright so I've been able to do some serious data clean-up. In this post I will summarize the updated data and point out a few small inconsistencies I see in the OP.
Regular Season
I looked at the Raw Plus Minus spreadsheet that I think Eminence also posted in this thread and realized that there is MJ regular season data for 1994-95 on there for the 17 games he played: +91 ON 668 ON Mins +26 OFF 153 OFF Mins. 1994-95 regular season can be added to the OP.
I noticed that the OP has different ON and OFF values for the 1987-88 season. Like mine, I think his data only includes the 42 full games and excludes the one game fragment on 01-09-88 so not sure why it's different?
I also have a different OFF for the 1992-93 season. For the 63 sampled games, the margin is +414 so since the ON is +489 the OFF value should be -75. Please confirm.
The total regular season data we have have for Jordan comprises 60% of his total career and 54% of his Bulls career.
Playoffs
First off I noticed a typo in the OP. The 1985 playoffs should have an OFF value of -32 and not -22.
I logged the Knicks and Pistons series for 1989 because the Thinking Basketball (TB) numbers didn't match the total score margins.
Knicks: +45 ON -20 OFF (was +65 ON -30 OFF)
Pistons: -16 ON -9 OFF (was -19 OFF +12 OFF)
1989 Total: +51 ON -47 OFF (was +63 ON -41 OFF)
I also logged the Sixers series for 1990 because the TB numbers again didn't match the total score margins.
Sixers: +45 ON -7 OFF (was +45 ON -9 OFF)
1990 Total: +100 ON -45 OFF (was +100 ON -47 OFF)
In the 1995 playoffs, I found an arithmetic error in Game 1 of the Hornets series that I logged. Instead of +11 ON -3 OFF it's actually +6 ON +2 OFF.
1995 Total: -14 ON +24 OFF (was -9 ON +19 OFF)
Here is the updated playoff picture.
I noticed some minor inconsistencies in both ON and OFF minutes but they aren't significant at all.
lessthanjake wrote:Djoker wrote:lessthanjake wrote:...
Did you get a chance to look at my post?Djoker wrote:
Alright so I've been able to do some serious data clean-up. In this post I will summarize the updated data and point out a few small inconsistencies I see in the OP.
Regular Season
I looked at the Raw Plus Minus spreadsheet that I think Eminence also posted in this thread and realized that there is MJ regular season data for 1994-95 on there for the 17 games he played: +91 ON 668 ON Mins +26 OFF 153 OFF Mins. 1994-95 regular season can be added to the OP.
I noticed that the OP has different ON and OFF values for the 1987-88 season. Like mine, I think his data only includes the 42 full games and excludes the one game fragment on 01-09-88 so not sure why it's different?
I also have a different OFF for the 1992-93 season. For the 63 sampled games, the margin is +414 so since the ON is +489 the OFF value should be -75. Please confirm.
The total regular season data we have have for Jordan comprises 60% of his total career and 54% of his Bulls career.
Playoffs
First off I noticed a typo in the OP. The 1985 playoffs should have an OFF value of -32 and not -22.
I logged the Knicks and Pistons series for 1989 because the Thinking Basketball (TB) numbers didn't match the total score margins.
Knicks: +45 ON -20 OFF (was +65 ON -30 OFF)
Pistons: -16 ON -9 OFF (was -19 OFF +12 OFF)
1989 Total: +51 ON -47 OFF (was +63 ON -41 OFF)
I also logged the Sixers series for 1990 because the TB numbers again didn't match the total score margins.
Sixers: +45 ON -7 OFF (was +45 ON -9 OFF)
1990 Total: +100 ON -45 OFF (was +100 ON -47 OFF)
In the 1995 playoffs, I found an arithmetic error in Game 1 of the Hornets series that I logged. Instead of +11 ON -3 OFF it's actually +6 ON +2 OFF.
1995 Total: -14 ON +24 OFF (was -9 ON +19 OFF)
Here is the updated playoff picture.
I noticed some minor inconsistencies in both ON and OFF minutes but they aren't significant at all.
I’ve seen it but have been too busy to go back and double check the numbers you mentioned there. Unfortunately, I’ve not been as systematic in organizing the data somewhere as I ideally should’ve been (i.e. I don’t just have this stuff in a spreadsheet somewhere), so double-checking is generally going to involve fully recounting/recalculating. Will aim to do it eventually and update the OP! In the meantime, I’m perfectly happy with people operating under the assumption that your adjustments are correct.

VanWest82 wrote:Unbelievable effort, guys!!
Here's a different (and very crude) way of sanity checking dipper13's plus/minus as for some reason that appears to be a point of contention. Using the average 92 Q1-Q4 MOV data I presented earlier itt, we see...
Q1: +3.182927
Q2: +1.121951
Q3: +4.085366
Q4: +1.975610
Jordan usually played almost all of the 1st and 3rd quarters and would come back in around the 7 min mark in 2nd and 4th give or take a min here or there. This was corroborated in another year (91? 96?) with a substitution pattern graphic shared by squared.
Let's assume for simplicity that Jordan played all of Q1 and Q3 which would give him an average of +3.634146 per quarter. Let's also assume that his plus/minus impact was for the most part uniform across all four quarters. This would lead to +2.119919 ON vs. -0.878050 OFF in Q2 and +2.119919 ON vs. -0.144309 OFF in Q4.
Adding the OFF samples together and prorating to get a full quarter gives us -1.226829. Then we multiply per quarter averages x4 to get +14.536585 ON vs. -4.907317 OFF and +19.443902 NET per-48.
This method is obviously extremely rough with a number of assumptions that are likely to be at least partially incorrect, but it's not supposed to be materially accurate. It's just supposed to provide supporting evidence in terms of directionality of Dipper's plus/minus sample. I would note as well that Bulls finished the year +10.4 MOV whereas in Dipper's sample they were only +7.8 MOV in 55 games (edit: just noticed Djoker's chart says 53 games so maybe the 2 games MJ didn't play in aren't included in which case it's +8.1 MOV over 53 games). So the likelihood is that both the ON and OFF full season samples would trend from Dipper's sample in the direction of my very rough estimate using quarters / substitution patterns. I would also note that my very rough results seem to track quite well with what we know from squared's 91 and 93 data. It doesn't seem to matter which way we do this, the results point to MJ being a net on-off monster in that pre-first retirement period.
Djoker wrote:falcolombardi wrote:OhayoKD wrote:Yeah, not sure about those 92 marks:
Taking it at face value anyway...
Make that 2006-2021 Lebron and the playoff stuff is comparable with a 1994 Bull-sized elephant missing and the regular-season stuff being comparable without 94 or the bulk of 95.
That is also despite Lebron playing a much larger minute sample and staggering significantly more with co-stars.
IOW, nice try
Yep, lebron extended prime is larger sample than all of jordan bulls career which is why i never understand why these comparisions are always framed as either career vs career (where it inevitably rewards shorter careers) or very specific short stretches instead of larger prime samples or non consecutive best years (which inevitably hurts players who got down/injured years in the middle of their primes)
Is arbitrary and does affect the sample size and reliability of the data for both prime and peak comparisions
Since we have raw ON/OFF and minutes, feel free to do your own comparisons but non-consecutive best years is an approach that makes no sense. You're literally removing the worse data points when the whole purpose of using larger samples (i.e. consecutive stretches) is for the data to stabilize.